Combining DEA and “Transformation-Stages”:
Management Strategies for the Disability Service
Units of the St. Georg Association
Abstract
In this paper we analyze the efficiency of social service units in a way very similar to the
design of hospital efficiency studies. The houses of the St. Georg Association care for
mentally disabled persons. The explicitly formulated goal of the association is to help the
patients to reach a higher quality of daily-life. Our approach shows the possibility to include
qualitative measures into health sector productivity analysis. We design our analysis in such
a way as to provide management information for controlling the service units. This is
accomplished with the help of portfolio techniques and norm strategies.
Structure
1 Introduction
2 Questions to be answered
3 St. Georg Association
4 Design of the Investigation
5 Results of the Investigation
6 Conclusion
1 Introduction
The health sector in almost all industrialized countries in the world is consuming a steadily growing share of those nations’ GDP.¹ It is therefore not surprising that more and more scientific efforts are being made to develop suitable management tools. Governmental health authorities responsible for granting budgets to the different
institutions within the sector are often especially interested in discovering inefficient units. Developing adequate instruments for measuring the efficiency of different institutions within the health sector is still an ongoing task. Grosskopf/Valdmanis (1987) convincingly state that “… empirical analysis of productive performance … is
complicated by the nature of the ‘productive’ process behind health care delivery. Clearly, the conceptual output – improved health status – is difficult to measure as an output.” During the last 15 years there has been a fast growing literature suggesting Data Envelopment Analysis DEA as an appropriate methodology to measure the
performance of health providing institutions.² There seem to be two main advantages of DEA that convince more and more researchers to apply this linear programming method:
1 DEA is able to process with multiple inputs and outputs that are expressed in technical terms rather than in (often unavailable) cost terms.
2 DEA allows for different hospitals to employ different production techniques.
The following table (1) provides a roughly structured picture of the DEA efficiency studies accomplished in the health sector³. It becomes evident that hospitals and nursing homes are of special interest. This paper is to be seen within this strand of literature when it examines the performance of social service units in a way very similar to the hospital productivity studies.⁴
¹For an empirical illustration see Ferlie E. et al. (1996).
²A discussion and an overview can be found in Banker/Das/Datar (1989), Brooks (1995) or Breyer/Zweifel (1996).
³This is, of course, not a complete overview.
⁴This seems to be appropriate because according to Weisbrod (1991) the main characteristics of health care are the strong effects on the quality of life and the complexity of the production processes. This also holds for social service units.
Table (1) DEA Efficiency Studies in the Health Sector
| Authors/Year/DMU | Inputs | Outputs | Efficiency Concept |
| Banker (1984) Hospitals | Nursing hours General service hours Ancillary service hours Beds | Patients under 14 years Patients between 14 and 65 Patients older than 65 | Labor/Capital efficiency Quantity oriented |
| Meyer/Wohlmann-stetter (1985) Hypothetical hospitals | Cost per case Investment per patient Patients under 60 years No emergency patients | Patient judgement % cases without complications | Cost efficiency Quantity/Quality oriented Differentiated inputs |
| Banker/Conrad/Strauss (1986) Hospitals | Nursing services Other services Capital | Patients under 14 years Patients between 14 and 65 Patients older than 65 | Labor/Capital efficiency Quantity oriented |
| Großkopf/Valdmanis (1987) Hospitals | Physicians Non-Physicians Admission Plant assets | Acute care Intensive care Surgeries Ambulatory&emergency care | Labor/Capital efficiency Quantity oriented |
| Borden (1988) Hospitals | Beds Nonpayroll expenses Staff Nurses | Cases in 9 DRG categories | “Total” efficiency Quantity oriented |
| Nyman/Bricker (1989) Nursing homes | Nursing hours Social service worker hours Therapist hours Other worker hours | SNF patients ICF patients Limited care patients Personal care patients Residential care patients | Labor efficiency Quantity oriented Differentiated outputs |
| Banker/Das/Datar (1989) Hospitals | 6 total departmental cost categories | 8 inpatient services 2 outpatient services | Cost efficiency Quantity oriented |
| Thanassoulis (1993) Hypothetical hospitals | Total cost | Teaching units Regular patients Severe patients | Cost Efficiency Quantity oriented Differentiated outputs |
| Donni (1994) Day-Care Centers | Nurses Cleaning/cooking staff Qualified staff | Infants Toddlers | Labor efficiency Quantity oriented |
| Byrnes/Valdmanis (1994) Hospitals | Registered Nurses Practical Nurses Management Staff Technical Staff Aides & orderlies Beds | Medical-surgical acute discharges Medical-surgical intensive care Maternity discharges | Labor/Capital efficiency Quantity oriented |
| Chilingerian (1994) Hospital Physicians | Average length of stay Cost ancillary services | Low-severity cases discharged in a healthier state High-severity cases discharged in a healthier state | Cost efficiency Quality oriented |
| Färe/Grosskopf/ Lindgren/Roos (1994) Hospitals | (Estimated) real labor (Estimated) real other input (exc. capital) | Inpatient discharges Long-term patient bed days Ambulatory doctor visits | Labor/material efficiency Quantity oriented |
| Norman/Stoker (1991) District Health Authorities | Headquarters administration cost 7 hospital services cost 2 community health services cost | Non-psychiatric in-patients discharges&deaths Psychiatric in-patients bed-days Attendance day-patients Day cases Attendance out-patients | Cost efficiency Quantity oriented |
| Roos (1997) Hypothetical eye surgery departments | Total cost | Patients Change in daily life activities | Cost Efficiency Strongly quality oriented |
The layout of the paper is as follows. In section 2 we will pose and explain the main questions within our investigation, while section 3 describes St. Georg Association as the research object. In section 4 the implementation and design of the public sector “transformation stages concept” within DEA is of special interest, while section 5 introduces the results of our calculations. Section 6 concludes with some general remarks.
2 Questions to be answered
The questions we asked when we started our research project were in principle twofold. On the one hand we wanted to know whether it was possible to trace efficiency even in a field as difficult as the care for disabled people. The last column of table (1) above soundly demonstrates that most of the recent studies neglect the quality of the output produced in the health sector.⁵ Thus, our study aims at explicitly defining and measuring quantitative and qualitative efficiency concepts for the social service units. On the other hand we were seeking to explore the possibilities of obtaining results that could be used to provide a management tool for controlling the system of different service units within the St. Georg Association. Here we wanted to be as close as possible to the methodologies known by business managers.
3 St. Georg Association
St. Georg is a non-profit organization that cares for mentally disabled persons of different ages with a variety handicaps. Most of the disabled people live together in groups that are structured similarly to families. The groups live together in units that are called „houses“. And there is always a caregiving person to whom the group
members relate most closely. In addition to the life in the „families“ the disabled persons go to work – when possible – or attend treatment by psychologists, psychiatrists or other therapists. The ultimate goal is to enable the group members to lead a life as independently as possible. The different „houses“ are grouped together within three regions and are controlled by regional managers who have to report to the central management. In 1997 the „total sales“ of these three units amounted to 124 Mio. German Marks. Within the next few years the organization will be restructured, which should lead to a group structure with the regional organizations as fully owned subsidiaries. The aim of the central management for starting this investigation was to develop instruments to control the system of different houses with respect to the efficient production of the services provided. In other words, management was looking for a system for benchmarking the houses. The DEA methodology seems to be an adequate instrument within that context.
⁵Moreover, the few studies considering qualitative efficiency concepts are based on the analysis of hypothetical hospitals.
4 Design of the Investigation
Measuring the efficiency in the public sector is in itself a difficult task. Measuring the efficiency of organizations that provide social services is even more difficult because of the measurement problems – especially with respect to the output-side. Most of the outputs lack reliable market prices. In order to grasp the structure of the production processes in this sector we rely on a theoretical approach going back to Bradford, Malt and Oates (1969). They divide the process of the production of public social services into several, so-called, „stages of
transformation“. The word transformation is chosen with respect to the transformation of inputs into outputs. The distinction between the stages is especially based on the consideration of different outputs. For our analysis we concentrate on the following three different „transformation stages“ given in table (2).
Table (2): Transformation Stages
| TS I: | Readiness To Produce Services |
| TS II: | Production of Services |
| TS III: | Effect of Services on Customers |
Stage I describes the ability of the different units to efficiently transform the respective factors of production into the desired capacity. In our context, Stage I is the readiness to care for a certain and fixed number of disabled patients. Stage II describes the efficiency of transforming inputs into „sold“ output. Below we will define what „sold“ output means within this context. Stage III is designed to compare the final outcome of care on the disabled persons with respect to the required inputs. Following this approach means to be more precise in the definition of what is the goal of production in the health sector. All studies in the above table (1) that use “quantity oriented” efficiency concepts aim at measuring productivity in stages I or II. Grosskopf/Valdmanis (1987) are well aware of this constraint when they label their approach as a model of “…the production of the intermediate good – health services.”⁶ Heads of health administrations, politicians and consultants often forget about the existence of stage III when they aim mainly at input saving activities.
As an analytical instrument to measure the efficiency of the service units, we apply the Data Envelopment Analysis. We chose DEA especially for two well-known reasons:
(a) DEA offers the possibility to include simultaneously variables that are measured in different units, such as hours of care, number of beds, staff costs etc. There is no need to transform or weigh those variables in order to accomplish an evaluation. This is quite advantageous especially with respect to the output of social service units.
(b) DEA identifies structural differences between the evaluated units as well as efficiency differentials. The effect is that non-efficient units are compared only against efficient units or combinations of efficient units that apply the most similar production technique.
For our computations we apply the following well known CCR⁷ (or constant returns to scale) model of DEA:
(1) 
⁶Grosskopf/Valdmanis (1987), p. 90.
⁷It is based on the seminal work of Charnes/Cooper/Rhodes (1978).
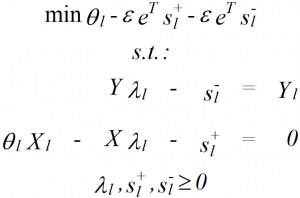
Y₁ and X₁ are the r- and s-vectors of outputs and inputs respectively of firm l; Y and X are the matrices of outputs and inputs of all firms within the sample. The parameter θ₁to be minimized accounts for efficiency, the n-vector λ₁ provides information about reference sets, s⁺ and s⁻ are the excess inputs and output slacks respectively, vector eΤ contains only elements 1, and ε is the positive so-called Non-Archimedean constant⁸. We calculate input oriented models (TS I and TS II) as well as an output-oriented model (TS III). In order to clearly rank the houses we additionally include the possible input and output slacks into the efficiency measure. Adding the slacks to the necessary proportional reduction is accomplished in the way suggested by Ali/Lerme (1990) or Chang/Guh (1991). Before the presentation of some of the results we have to define the input/output models that we apply to describe the production processes on the three transformation stages. We decided to calculate separate models for each transformation stage because they shed light on totally different managerial problems.⁹ The following table (3) provides the details.
⁸See Charnes/Cooper (1984).
⁹Additionally, the output side seems to provide only constrained possibilities for the management of the DMUs to substitute between outcomes.
Table 3: I/O models with respect to transformation stages
| Model | Inputs | Outputs |
| TS I (capacity) | Staff (FTE) Other costs (DM) | Maximum capacity (beds*days) |
| TS II (production) | Staff (FTE) Other costs (DM) | Days charged to customers |
| TS III (effect) | Staff (FTE) Other costs (DM) Days charged to customers | Hours that „parent persons“ care for group members |
We are aware of the fact that especially the variable on the output side of our model TS III is a very rough proxy for the effect of care on the disabled persons.¹⁰ The validity of that variable is based on the assumption that the more hours of care by a parent person a disabled person experiences the stronger is the positive effect on the personal development. The management of the St. Georg Association is about to introduce a system of assigning an outside tutelary to each of the disabled patients. Management plans to direct a questionnaire to those neutral guardians in order to collect information about the development of the patients. After receiving those questionnaires, the TS III model can be re-calculated with more precise data.
5 Results of the Investigation
In this section we are going to present the results of our investigation. We proceed by providing the efficiency scores of the DEA runs for TS I and TS II first. Then those results are combined into a strategic management portfolio. This portfolio serves as a basis to develop management norm strategies. The findings of TS III are then added and interpreted with respect to the outcomes of TS I and TS II. Table (4) shows how efficiently the different houses produce their respective maximum capacity. This represents the efficiency concept connected with stage I. In column 1 we plotted the position of a certain house within this ranking. Column 2 contains the identification number of the houses, and column 3 the input oriented DEA efficiency score. Columns 4 and 5 are concerned with the number of staff members and the amount of other costs that would have to be saved to become efficient. In the last column (Peer House) we display the houses that should serve as yardsticks for the
inefficient ones. Those were identified by using the weights of the efficient units within the λ vectors of the inefficient houses. We do not want to extend the interpretations of those numbers any further, especially because this first run is very conventional and the possibilities to save inputs are evident.
With respect to the heterogeneous production techniques, the two efficient houses represent production that is both more capital intensive (DMU #11) and more staff (or labor) intensive (DMU #6). This differentiation was confirmed by the intuitive judgements of the members of the central management.
¹⁰For more details and especially the variable “care-output-unit” see Johnson et al. (1999)
Table 4: Results TS I (capacity)
| POSITION | HOUSE | EFFICIENCY | STAFF SAVING | OTHER COSTS SAVING | PEER HOUSE |
| 1 | 6 | 1,00000 | 0,0 | 0,0 | 6 |
| 1 | 11 | 1,00000 | 0,0 | 0,0 | 11 |
| 3 | 10 | 0,98288 | 0,2 | 4703,0 | 11 |
| 4 | 31 | 0,94887 | 0,6 | 15177,7 | 11 |
| 5 | 28 | 0,94455 | 1,1 | 15091,3 | 6 |
| 6 | 17 | 0,93614 | 0,9 | 19912,1 | 11 |
| 7 | 4 | 0,93340 | 2,7 | 35878,2 | 6 |
| 8 | 27 | 0,80799 | 4,0 | 61580,7 | 6 |
| 9 | 21 | 0,78799 | 8,2 | 154260,6 | 11 |
| 10 | 5 | 0,75016 | 4,7 | 117123,5 | 11 |
| 11 | 20 | 0,74672 | 4,6 | 118707,8 | 11 |
| 12 | 22 | 0,74234 | 10,8 | 289018,0 | 11 |
| 13 | 1 | 0,73662 | 11,9 | 262986,0 | 11 |
| 14 | 9 | 0,73023 | 6,8 | 146458,7 | 11 |
| 15 | 25 | 0,73019 | 4,9 | 62984,7 | 6 |
| 16 | 23 | 0,72676 | 10,0 | 203501,8 | 11 |
| 17 | 12 | 0,71258 | 9,9 | 167522,2 | 11 |
| 18 | 2 | 0,70986 | 9,8 | 249881,3 | 11 |
| 19 | 24 | 0,69967 | 7,2 | 96810,2 | 6 |
| 20 | 19 | 0,67702 | 11,6 | 200210,1 | 11 |
| 21 | 26 | 0,67297 | 2,9 | 184511,7 | 11 |
| 22 | 3 | 0,67141 | 4,4 | 98097,6 | 11 |
| 23 | 14 | 0,66830 | 5,3 | 204715,0 | 11 |
| 24 | 8 | 0,66827 | 6,2 | 100646,2 | 6 |
| 25 | 16 | 0,66425 | 7,1 | 152950,6 | 11 |
| 26 | 29 | 0,66077 | 8,9 | 128310,0 | 6 |
| 27 | 18 | 0,65257 | 14,2 | 277628,9 | 11 |
| 28 | 13 | 0,65161 | 8,7 | 135980,8 | 6 |
| 29 | 30 | 0,62609 | 9,0 | 146981,8 | 6 |
| 30 | 15 | 0,59932 | 14,4 | 393121,6 | 11 |
| 31 | 7 | 0,59261 | 12,0 | 246703,6 | 11 |
In the next table (5) we present the results of the TS II run. Here we want to analyze how efficiently the houses adapted the consumption of inputs to the amount of care that could really be sold to customers. For the managers of St. Georg Association it contains information about re-scaling possibilities for the inefficient DMUs. The structure of this table is exactly the same as in table (4) above. The most important result of this table is that there seem to be differences in the ability of the managers of the houses to adapt to the demand for care. Some houses produce the readiness to care quite efficiently (house #6) but fail in adjusting to the demanded „bed-days“ by customers. Others seem to offer their capacity with too high amounts of inputs but afterwards produce the sold „care days“ efficiently. It should become clear that identifying those different patterns of strength and weaknesses leads to developing management strategies for the respective houses. We have applied the portfolio technique to assess the positions of the different houses with respect to their performances.
Table 5: Results TS II (production)
| POSITION | HOUSE | EFFICIENCY | STAFF SAVING | OTHER COSTS SAVING | PEER HOUSE |
| 1 | 3 | 1,00000 | 0,0 | 0,0 | 3 |
| 1 | 11 | 1,00000 | 0,0 | 0,0 | 11 |
| 1 | 28 | 1,00000 | 0,0 | 0,0 | 28 |
| 4 | 4 | 0,99178 | 0,3 | 4428,2 | 28 |
| 5 | 17 | 0,96659 | 0,5 | 10417,5 | 3 |
| 6 | 10 | 0,90337 | 1,1 | 26545,2 | 3 |
| 7 | 31 | 0,89758 | 1,2 | 30402,9 | 3 |
| 8 | 9 | 0,85700 | 3,6 | 77635,0 | 3 |
| 9 | 27 | 0,85122 | 3,1 | 47716,1 | 28 |
| 10 | 25 | 0,82618 | 3,1 | 40576,7 | 28 |
| 11 | 6 | 0,81664 | 6,2 | 74978,5 | 28 |
| 12 | 21 | 0,79868 | 7,8 | 146482,4 | 3 |
| 13 | 22 | 0,79663 | 8,5 | 228120,7 | 11 |
| 14 | 1 | 0,78070 | 9,9 | 218971,9 | 3 |
| 15 | 20 | 0,76722 | 4,2 | 109099,8 | 3 |
| 16 | 5 | 0,76304 | 4,5 | 111085,4 | 3 |
| 17 | 24 | 0,75913 | 5,8 | 77643,5 | 28 |
| 18 | 23 | 0,75419 | 9,0 | 183072,7 | 3 |
| 19 | 12 | 0,74754 | 8,7 | 147145,8 | 28 |
| 20 | 30 | 0,72423 | 6,6 | 108403,5 | 28 |
| 21 | 19 | 0,71078 | 10,4 | 179282,9 | 28 |
| 22 | 2 | 0,70677 | 9,9 | 252542,6 | 3 |
| 23 | 29 | 0,70338 | 7,8 | 112193,3 | 28 |
| 24 | 16 | 0,69599 | 6,4 | 138491,5 | 3 |
| 25 | 13 | 0,69104 | 7,7 | 120590,8 | 28 |
| 26 | 18 | 0,68704 | 12,8 | 250084,1 | 3 |
| 27 | 8 | 0,66919 | 6,2 | 100367,1 | 28 |
| 28 | 14 | 0,66504 | 5,4 | 185319,6 | 11 |
| 29 | 26 | 0,63890 | 3,2 | 132714,7 | 11 |
| 30 | 15 | 0,63662 | 13,1 | 356525,2 | 11 |
| 31 | 7 | 0,58951 | 12,1 | 248580,8 | 3 |
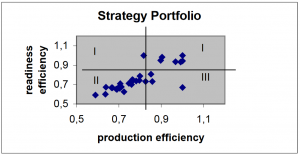
The next figure (1) is a first attempt to plot the strategic positions of the DMUs. Drawing lines with respect to the average performance in the two calculations under consideration, one can assign each house to one of four strategic fields.¹¹ One is now able to discuss with the management of the St. Georg Association the development of norm strategies for these fields. Norm strategies are going to serve as an instrument for the strategic controlling of the different houses. Moves of DMUs from one field into another field indicate changes in their respective efficiency performances and deserve modified strategies.
¹¹For an application of this approach to bank branches see Westermann (1999)
Strategies for the fields:
• Houses assigned to field I supply their capacity with above average efficiency. But the production of the sold output shows weaknesses. Here it seems to be necessary either to intensify the efforts to gain new customers or to downscale the house.
• Houses in field II should try a clear strategy of contraction in inputs because they are too input consuming in both respects: readiness to care and production of care.
• Houses situated in field III should be able to expand their capacities without a proportionate input increase.
• The units in the fourth field are above average within both respects. They should expand their businesses if that is possible. They also should serve as benchmarks for inefficient houses.
Thus, the analysis accomplished is still quite orthodox with respect to the efficiency concept pursued. In a next step we try to integrate the results (see table 6) from the TS III DEA run. This computation is output oriented and aims at displaying the possibilities of the houses to dedicate further time to the disabled persons. The best DMUs efficiently transform the three inputs Staff (FTE), Other Costs (DM) and Days Charged to Customers into the single output Hours „Parent Persons“ Care for Group Members.¹²
Figure (1): Strategy Portfolio
¹²For more details and especially the variable “care-output-unit” see Johnson et al. (1999)
Table 6: Results TS III (outcome)
| POSITION | HOUSE | EFFICIENCY | INCREASE „PARENT“ PERSON H | PEER HOUSE |
| 1 | 6 | 1,00000 | 0,0 | 6 |
| 1 | 7 | 1,00000 | 0,0 | 7 |
| 1 | 9 | 1,00000 | 0,0 | 9 |
| 4 | 29 | 1,00000 | 0,0 | 29 |
| 5 | 4 | 1,07474 | 2876,0 | 29 |
| 6 | 27 | 1,08416 | 1887,6 | 29 |
| 7 | 28 | 1,13794 | 2528,6 | 29 |
| 8 | 25 | 1,16942 | 2582,5 | 6 |
| 9 | 18 | 1,28238 | 10957,8 | 7 |
| 10 | 19 | 1,28238 | 9585,0 | 29 |
| 11 | 12 | 1,32613 | 10566,7 | 29 |
| 12 | 5 | 1,35236 | 7829,4 | 9 |
| 13 | 17 | 1,43528 | 7050,2 | 9 |
| 14 | 10 | 1,45590 | 6359,5 | 9 |
| 15 | 30 | 1,48588 | 9382,5 | 29 |
| 16 | 21 | 1,49442 | 17828,5 | 9 |
| 17 | 8 | 1,51976 | 7143,3 | 29 |
| 18 | 1 | 1,54622 | 24066,4 | 9 |
| 19 | 16 | 1,54752 | 10123,9 | 7 |
| 20 | 2 | 1,55580 | 18348,5 | 9 |
| 21 | 15 | 1,66954 | 21109,4 | 9 |
| 22 | 23 | 1,67482 | 20568,7 | 9 |
| 23 | 13 | 1,70357 | 11569,7 | 29 |
| 24 | 31 | 1,72456 | 9212,7 | 9 |
| 25 | 20 | 1,76058 | 12763,7 | 9 |
| 26 | 22 | 1,93421 | 39759,3 | 9 |
| 27 | 24 | 1,96320 | 12027,8 | 29 |
| 28 | 3 | 2,12601 | 11784,5 | 9 |
| 29 | 11 | 2,13517 | 11447,8 | 9 |
| 30 | 26 | 3,02627 | 17708,1 | 9 |
| 31 | 14 | 3,37857 | 28205,3 | 9 |
What can social service managers learn from this third strand of computations? It worth to notice is for example that house #6 that was efficient in producing capacity to care is also efficient in caring for the patients. House #7 in contrast performs very badly in capacity production but is efficient in dedicating time to the group members. For reasons of a comprehensive insight in the efficiency structures of St. Georg Association it seems to be appropriate to construct a strategic portfolio similar to figure (1). In order to avoid a three-dimensional plot in table (7) we apply a three-digit approach to indicate high/low efficiency in the three DEA runs TS I, TS II and TS III. Column 5 in table (7) additionally provides the allocation of houses across the respective fields.
Table 7: Strategic Fields in the Three Dimensional Case
| TSI Efficiency | TSII Efficiency | TSIII Efficiency | Field | Field Population |
| High | Low | Low | 1 | - |
| High | High | Low | 2 | 2 |
| High | High | High | 3 | 7 |
| High | Low | High | 4 | - |
| Low | Low | Low | 5 | 2 |
| Low | High | Low | 6 | 2 |
| Low | High | High | 7 | 2 |
| Low | Low | High | 8 | 11 |
It is obvious that a remarkable percentage (27%) of houses is situated in field 3 and thus can be labeled as being above average in their efficiency with respect to all three efficiency concepts. Another global feature seems to be the trade-off between TSI/TSII and TSIII. Exactly 50% (field 2 and 8) of the DMUs trade capacity and production
efficiency against outcome efficiency. With respect to the strategies that should be pursued for the houses in the fields 1-8 we will concentrate only on one illustrating example. The distinguishing feature of the most populated field 8 is the low efficiency in the transformation of staff and other cost into capacity and sold beds. In those houses the „parent persons“ can avoid management and auxiliary tasks because other staff are responsible for that. Management should explore the possibilities of especially reducing auxiliary staff without decreasing the extraordinary high level of care.¹³
6 Conclusion
In this paper we analyze the efficiency of social service units in a way very similar to the design of hospital efficiency studies. The houses of the St. Georg Association care for mentally disabled person. The explicitly formulated goal of the association is to help the patients to reach a higher quality of daily-life. Thus, it is not reasonable to tackle the efficiency problem with bare quantitative concepts. Our approach shows the possibility of including qualitative measures into health sector productivity analysis. Moreover, we design our analysis such that it will provide management with information for controlling the service units. This is accomplished with the help of portfolio techniques and norm strategies. Our variable for the effects of care on the disabled persons is a very rough proxy. The planned questionnaire containing a neutral judgement on the condition and development of the disabled persons is going to provide a more adequate database. A second weakness of our present analysis is the absence of data with respect to the structure of handicaps and the differences between the houses. This problem is going to be solved by assigning the group members to different handicap or case groups. The number of persons within those groups can then be used as output variables in further DEA calculations. We are aware of the fact that the present analysis is not at all perfect but we hope to be on a way that it nevertheless can help the management of the St. Georg Association to care more efficiently for their customers. But caring more efficiently must not neglect all those non-economic variables inherent in human relations.
¹³In addition, it would be worth analyzing the situation in those houses with a more decomposed staff variable.